A look back at the Royston housing market over the last decade
With all of us completing the Census, a couple of weeks ago, it made me realise profoundly that mine and my family’s life, which from our own point of view seems unique and delightful, makes us all into a series of statistics for the Census gatherers to pore over. To digest and regurgitate facts, figures and trends for those who are interested in the ever- changing social circumstances of these islands.
However, the information from the Census is vital to improving our lives – Governments can plan the future with the information it provides and we in turn can wonder about the lives of our past generations with the information provided therein historically if we so wish.
Whilst the information from this Census won’t be published until March 2023, let us have a look at what has been happening in the Royston property market since the last time we completed the Census in 2011.
Just to remind you, 2011 saw the wedding of Prince William and Kate Middleton, Mr Cameron was the PM, there was the last flight of the Space Shuttle and Game of Thrones premiered.
Whilst in the Royston property market …
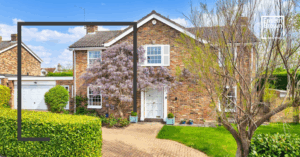
- The average price paid for a Royston detached home in the last 12 months has been £592,500. The average value of a Royston detached home has risen by 43.3% in the last 10 years or £183,000
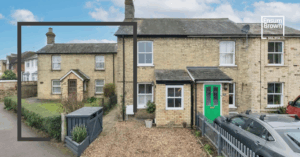
- The average price paid for a Royston semi-detached home in the last 12 months has been £380,400. The average value of a Royston semi-detached home has risen by 54.1% in the last 10 years or £129,400
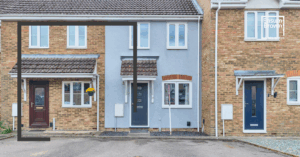
- The average price paid for a Royston town house/terraced home in the last 12 months has been £296,800. The average value of a Royston town house/terraced home has risen by 45.1% in the last 10 years or £101,400
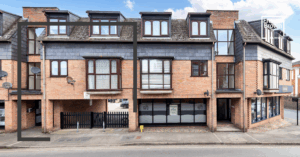
- The average price paid for a Royston apartment/flat in the last 12 months has been £187,400. The average value of a Royston apartment/flat has risen by 42.2% in the last 10 years or £54,900
New properties built in Royston…
Irrespective of any dip in Royston house prices or transactions when the Stamp Duty Holiday ends in the autumn, this is a trend that looks set to continue, with no sign that supply of new homes is anywhere near to keeping pace with demand for households.
There have only been 554 new properties built in Royston in the last 10 years, that’s less than 5 a month. That means the population in Royston has risen by 2.45 people for every new home built over that decade.
Nationally, the Country has only built just over 180k homes a year over the last decade, 120k less than the national target of 300k. In the meantime, the population has grown by more than 4 million.
When looking locally at the size of new build property in Royston, the average property is just over 900 sq. ft., which is 39% larger than a decade ago.
Rents in Royston …
Whether you are a winner or loser in terms of rental values depends on whether you are a Royston landlord or a Royston tenant.
The average rent for a property in Royston currently stands at £826 per month, whilst a decade ago, it was £688 per month
This means private rents have increased by £1.15 a month for the past ten years. Interesting, when compared to the national average of 98p a month whilst in London, rents have grown by £4.64 a month.
The next 10 years of the Royston Property Market…
The next ten years will also be just as fascinating. To try and predict would be a fool’s game.
For example, who would have believed what the Royston property market has done in the last 12 months since the start of Lockdown 1.0. The number of transactions (i.e. people moving) in turn with UK house prices having risen so much in the last year … all during a worldwide pandemic and at a time of such mayhem and havoc in the UK and world economy, is nothing short of remarkable … the question is – is it sustainable?
Read these articles in the coming months and years and I will share with you what is happening to the value of your Royston property, be you a Royston homeowner or Royston landlord.
